Render charts with Chart.js
In this tutorial you'll run Chart.js inside an
mcp-v8 isolate and get a chart out of it — first as SVG, then as a PNG file
rasterized and written entirely from JavaScript.
This is the Chart.js Using from Node.js example, adapted to a runtime with no native modules. It shows how to work around a library whose usual Node companion is a native addon: keep the pure-JS part, and replace the native part with something that runs in the isolate.
Prerequisites
mcp-v8installed (see Install).curlandjq.- The repo checked out, for the example source:
git clone --depth 1 https://github.com/r33drichards/mcp-js
cd mcp-js
The complete script lives at examples/chartjs/chart.js.
Why the upstream example needs adapting
The Chart.js docs draw onto a skia-canvas
canvas. That package — like node-canvas — is a native Node addon, and the
isolate has no Node ABI to load one with. Importing it fails immediately:
await import("npm:skia-canvas");
// ReferenceError: window is not defined
Chart.js itself is fine. It is pure JavaScript, it imports cleanly with
npm: specifiers, and when no window is
present it selects its own BasicPlatform — so it never reaches for the DOM.
All it needs from a "canvas" is an object with getContext("2d") and pixel
dimensions.
So the example supplies the canvas in JavaScript:
| Piece | Provided by |
|---|---|
| Canvas2D API → SVG | svgcanvas, pure JS |
document, XMLSerializer, DOMMatrix, DOMPoint |
a ~90-line shim at the top of the example |
| Text metrics | approximated per glyph — there is no font engine in the isolate |
| SVG → PNG (optional) | @resvg/resvg-wasm through the WebAssembly API |
Step 1 — Start the server with module imports enabled
SVG output needs nothing but external imports:
mcp-v8 --http-port 8080 --allow-external-modules
chart.js and svgcanvas are fetched from esm.sh at import time. The example
pins both to exact versions (npm:chart.js@4.5.1, npm:svgcanvas@2.6.0) —
always pin npm: specifiers so a run months from now resolves to the same code.
To control which packages may be imported at all, add a modules policy — see
ES module imports.
Step 2 — Run the example
curl -s http://localhost:8080/api/exec \
  -H 'Content-Type: application/json' \
  -d "$(jq -Rs '{code: .}' examples/chartjs/chart.js)"
That returns an execution_id. The SVG is printed to the console, so read it
back from the output endpoint (see
Asynchronous execution & output):
curl -s "http://localhost:8080/api/executions/<execution_id>/output" \
  | jq -r '.data' > chart.svg
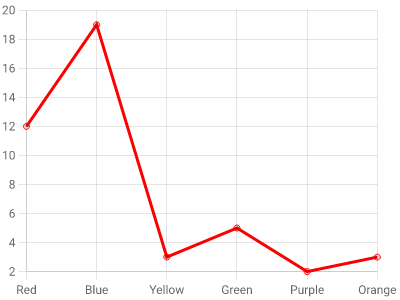
Open chart.svg and you have the chart from the Chart.js docs — a line across
Red, Blue, Yellow, Green, Purple, Orange with values 12, 19, 3, 5, 2, 3.
Step 3 — How the shim fits together
Three small pieces make Chart.js believe it has a canvas. First, a DOM stand-in
for svgcanvas to build its SVG tree with:
globalThis.document = {
  createElementNS: (_ns, name) => new El(name),
  createTextNode: (t) => new TextNode(t),
  createElement(name) {
    if (name === "canvas") return { getContext: () => measurer };
    /* ... <span> whose `font:` shorthand is parsed into style longhands ... */
  },
};
globalThis.XMLSerializer = class {
  serializeToString(node) { return node.toXML(); }
};
Second, measureText(). Chart.js sizes axes, ticks, and labels from it, and
the isolate has no fonts, so the example approximates advance widths per glyph:
const measurer = {
  font: "10px sans-serif",
  measureText(text) {
    const size = parseFloat(parseFont(this.font).fontSize) || 10;
    return { width: measure(text, size), /* ...ascent/descent... */ };
  },
};
Third, the canvas handed to Chart.js — an object literal, wired to the
svgcanvas context:
const ctx = new Context({ width: 400, height: 300 });
const canvas = { width: 400, height: 300, style: {}, getContext: () => ctx };
ctx.canvas = canvas;

const chart = new Chart(canvas, {
  type: "line",
  data: { /* ... */ },
  options: { responsive: false, animation: false, devicePixelRatio: 1 },
});

const svg = ctx.getSerializedSvg(true);
chart.destroy();
responsive: false because there is no DOM to resize against, and
animation: false so the chart is fully drawn by the time the SVG is
serialized.
Step 4 — Get a PNG instead
Set OUTPUT = "png" at the top of examples/chartjs/chart.js. Rasterizing
adds two capabilities: fetch, to pull the resvg WASM binary and a font, and
fs, to write the file. Both are denied by default and need
policies. The example ships the two minimal ones in
examples/chartjs/policies/:
# fetch.rego
package mcp.fetch

default allow = false

allow if {
    input.method == "GET"
    input.url_parsed.host == "unpkg.com"
}
# fs.rego
package mcp.filesystem

default allow = false

allow if {
    startswith(input.path, "/tmp/chart-out/")
}
Start the server with both policies — the url fields must be absolute
file:// URLs, so from the repo root:
mkdir -p /tmp/chart-out
mcp-v8 --http-port 8080 --allow-external-modules \
  --policies-json "{\"fetch\":{\"policies\":[{\"url\":\"file://$PWD/examples/chartjs/policies/fetch.rego\"}]},
                    \"filesystem\":{\"policies\":[{\"url\":\"file://$PWD/examples/chartjs/policies/fs.rego\"}]}}"
Submit the script the same way as before. resvg runs as WebAssembly inside the isolate; because it ships without system fonts, the example fetches a TTF and hands it over explicitly:
const { initWasm, Resvg } = await import("npm:@resvg/resvg-wasm@2.6.2");
await initWasm(await (await fetch(".../index_bg.wasm")).arrayBuffer());

const png = new Resvg(svg, {
  font: { fontBuffers: [font], defaultFontFamily: "Roboto", loadSystemFonts: false },
  background: "white",
}).render().asPng();

await fs.writeFile("/tmp/chart-out/output.png", png);
The result — produced start to finish inside the isolate:
Things to keep in mind
- Text metrics are approximate, so label positions can differ from a browser render by a pixel or two. Nothing in the isolate can measure a real font.
- The first run is slower: the npm modules (and, for PNG, the WASM binary and font) are fetched over the network.
- The same shim works for other chart types — register the controllers and
elements they need (
BarController/BarElement,ArcElement, and so on). - Anything native stays out of reach. Where a library offers a WASM build (as resvg does), that is the way in.
For the full source, see examples/chartjs/chart.js and
examples/chartjs/README.md.